Click on the Reports tab in the navigation menu at the top of the screen.

Next, click on the ‘Dashboard Reports' folder to see a list of all available reports.
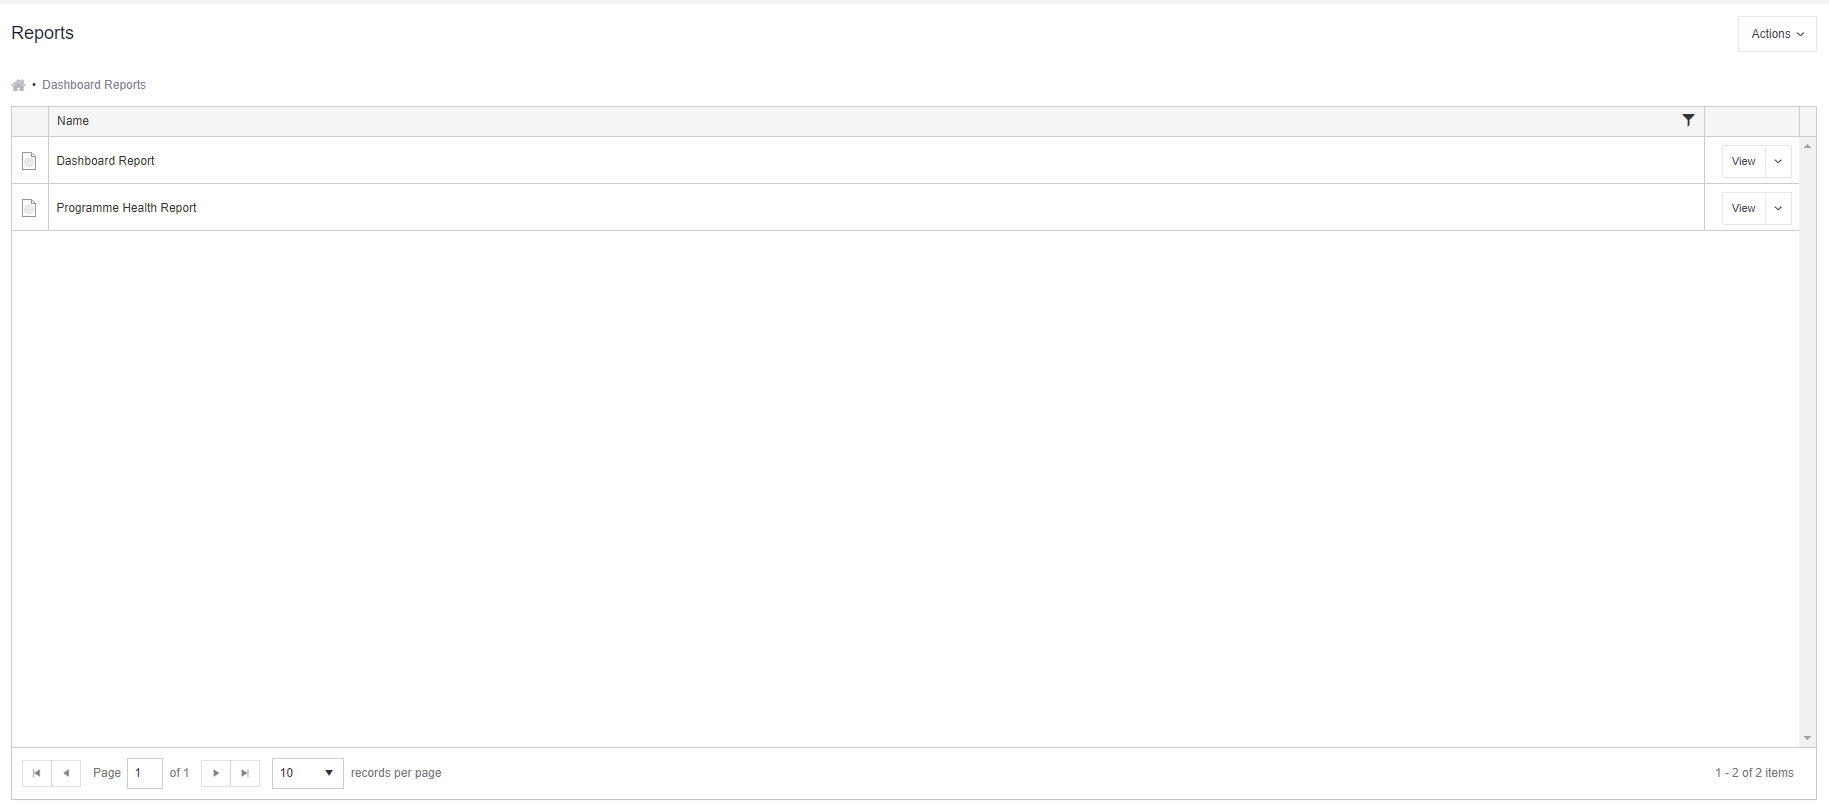
To run a report, simply click on the View button.
Dashboard Report
Select from the following report filters:
- Hierarchy Start Point - select which group of projects or programmes to include in the report. This filter uses the hierarchy links to determine what data pulls in. See: How to create and manage hierarchies.
- Depth Analysis - select how many levels down in the hierarchy group you want to include.
- Stages - select which stage(s) you want to look at for those projects.
- Sections to Show - select from charts, summary, costs, key milestones, key risks, key issue. Select one or multiple.
Programme Health Report
Select from the following report filters:
- Hierarchy Start Point - select a programme. This filter uses the hierarchy links to determine what data pulls in. See: How to create and manage hierarchies.
Finally, click on View Report in the top right to generate a new version.
Your report can be downloaded in a number of different formats. Click on the ‘disk’ icon and select from the list. The report will automatically download.
Please note, Microsoft does not currently support the exporting or printing of data via a Teams App. Please use Verto through your web browser when these features are required.
Top Tips
- You can select different filter options and run the same report multiple times.
- You can set-up a report subscription and have your preferred report delivered straight into your inbox.
- Click here to download an example dashboard report.