HomeProject UsersUsing DashboardsIntroduction to dashboards

    Using Dashboards

    • Introduction to dashboards
    • How to drilldown into project data from your dashboard
    • How to add a dashboard from the template library
    • How to create your own dashboard
    • What are dashboard widgets?
    • How to add a widget
    • How to add filters to a widget
    • How to edit or delete widget filters
    • How to display data when clicking on a widget
    • How to edit the title of a widget
    • How to copy a widget
    • How to delete a widget
    • How to create a dashboard template

    Introduction to dashboards

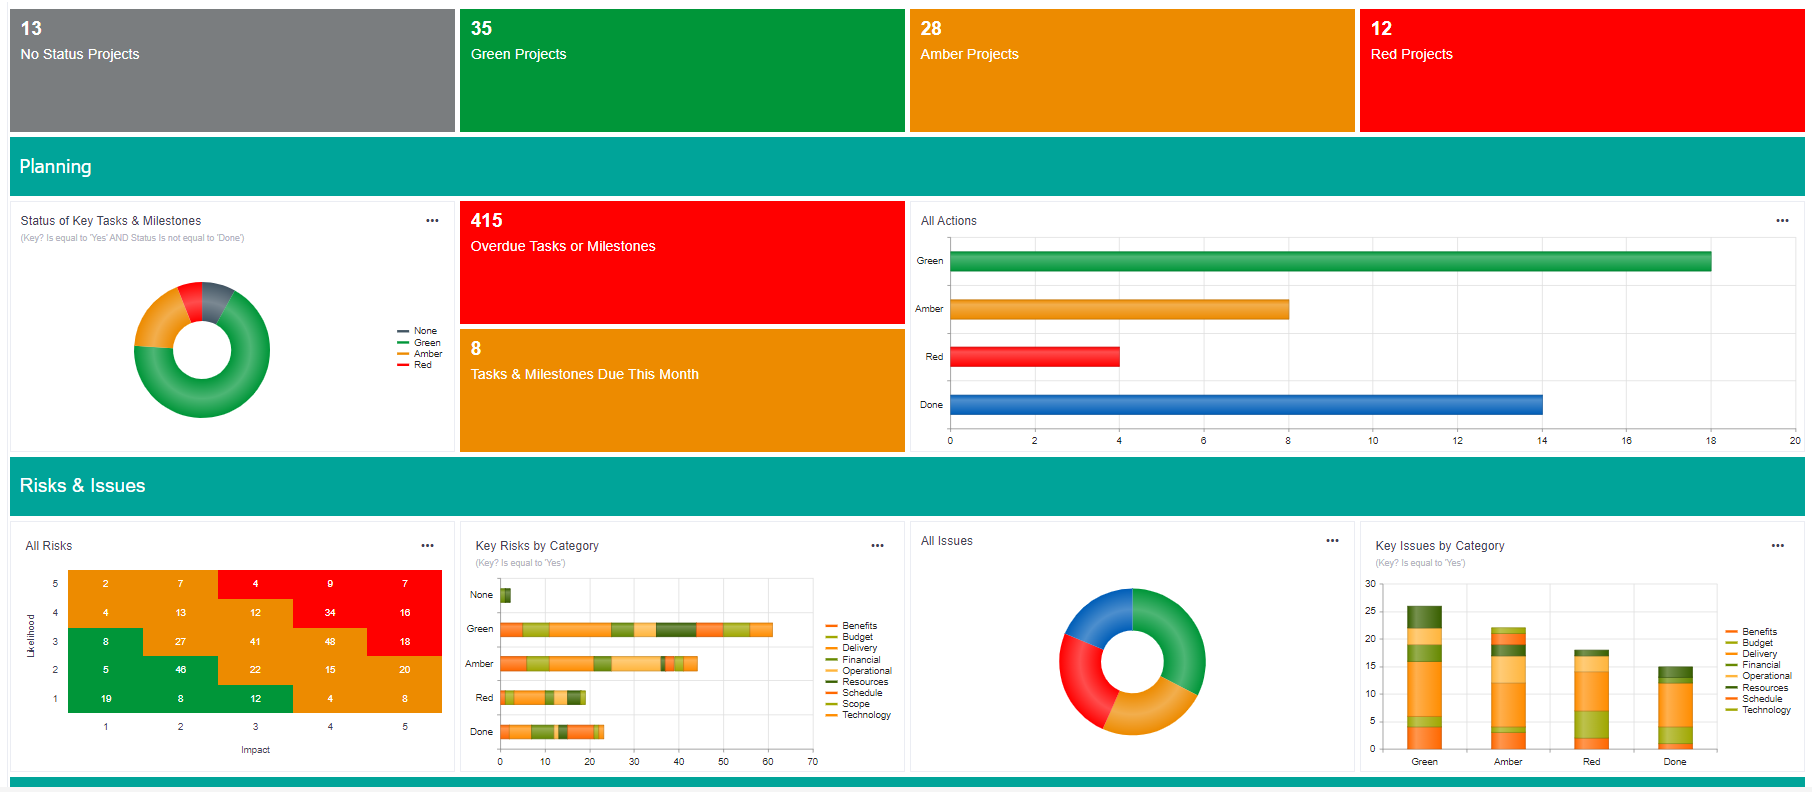
    A dashboard is a live, interactive view of data held within Verto, and can be displayed as pie charts, bar charts, tables, Gantt charts and much more.

    Viewing the data in one central location makes it easy for teams to collaborate and quickly assess the current status of a Portfolio, Programme or Project.  Users can also drill down deeper into any aspect of the data by simply clicking on any widget on the dashboard.


    Introduction to dashboards How to drilldown into project data from your dashboard How to add a dashboard from the template library How to create your own dashboard What are dashboard widgets? How to add a widget How to add filters to a widget How to edit or delete widget filters How to display data when clicking on a widget How to edit the title of a widget How to copy a widget How to delete a widget How to create a dashboard template

    Knowledge Base Software powered by Helpjuice

    Definition by Author

    0
    0