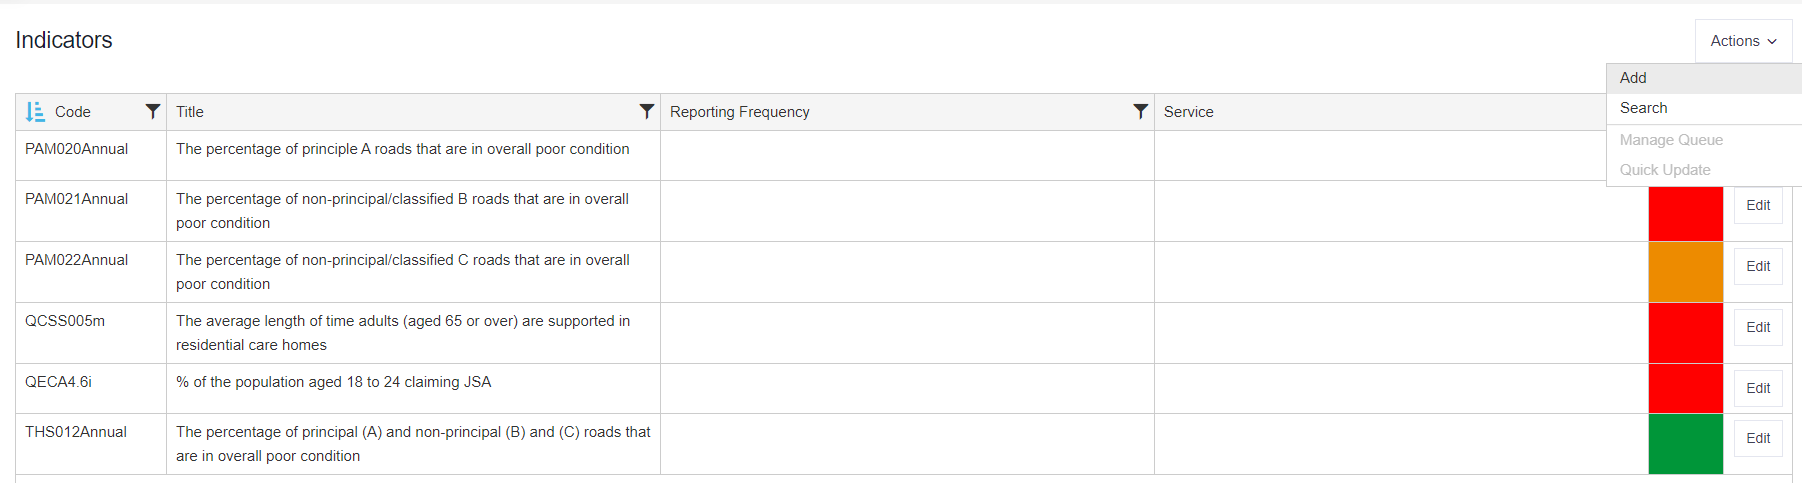
To add an indicator, click on the Indicators tab in the navigation menu at the top of the screen. If you are in the Verto Teams App, this will be located under the Verto tab. This area will provide access to all indicators in the site. Note: only a Stage Administrator can add new indicators.
New indicators can be added by clicking on Actions > Add. A blank indicator record will be created
Adding indicator meta-data
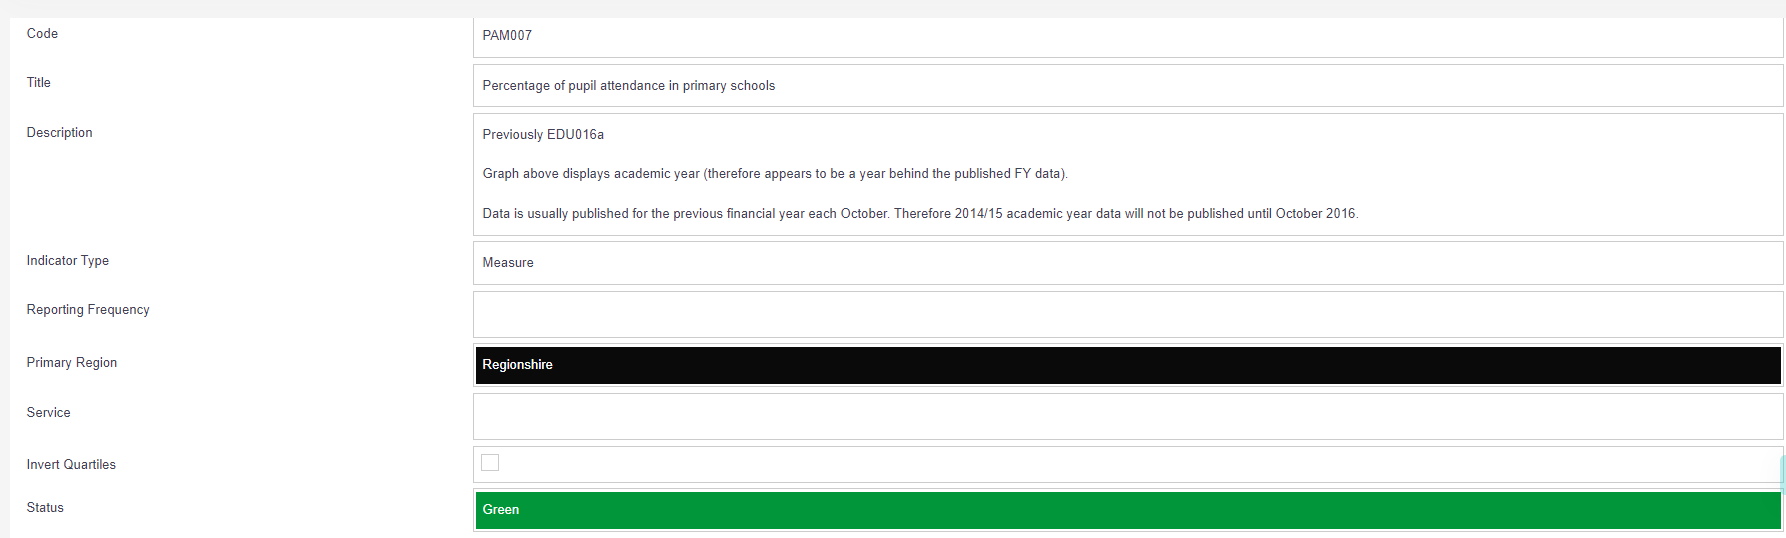
There are a of set core fields included in this area which can be amended as needed:
- Code (mandatory field) - system generated but can be amended if needed.
- Title (mandatory field) - title of the indicator.
- Description - this is a simple text field allowing for background narrative to be added.
- Indicator Type – this is lookup which allows indicators to be categorised i.e. indicator, metric, output etc.
- Reporting Frequency (mandatory field) – this is the reporting frequency of the indicator i.e. weekly, monthly, quarterly, yearly. Please contact Verto Support to amend the lookup contents.
- Primary Organisation (mandatory field) – every indicator must have a primary organisation selected, and in most cases, this will be the organisation using Verto. The primary organisation for an indicator will be automatically displayed on the graph using the default line and colour. If needed, data points can also be added to an indicator for other organisations, therefore offering the ability to compare progress with peers. If multiple organisation data-points are added to an indicator, these will be represented by different coloured lines on the graph.
- Service – this is a lookup which defines the service area(s) responsible for the indicator.
- Invert Quartiles (mandatory field) – checking this box will swap the thresholds around i.e. if for the specific indicator lower numbers are better than higher numbers. For example, a high number of GCSE passes is good whereas low number of absences is good.
- Status – the indicator status can be updated manually.
- Indicator Members - Users added as an indicator member will have direct access to the indicator via the Indicators tab. Depending on the role permissions assigned, access will either be Read/Edit or Read Only.
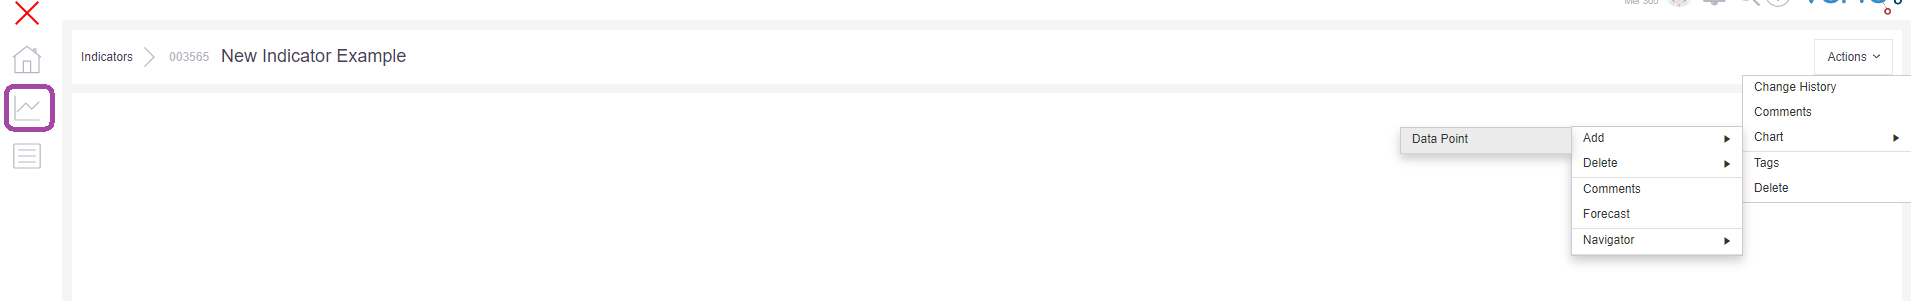
Adding a new data point
Data-points can be added to an indicator by clicking on the Graph icon on the left-hand side of the screen, and then selecting Actions > Chart > Add > Data Point.
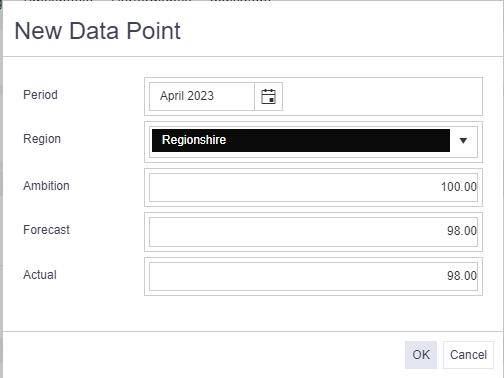
After the first data-point has been added to an indicator, a new data table and graph outline will appear.
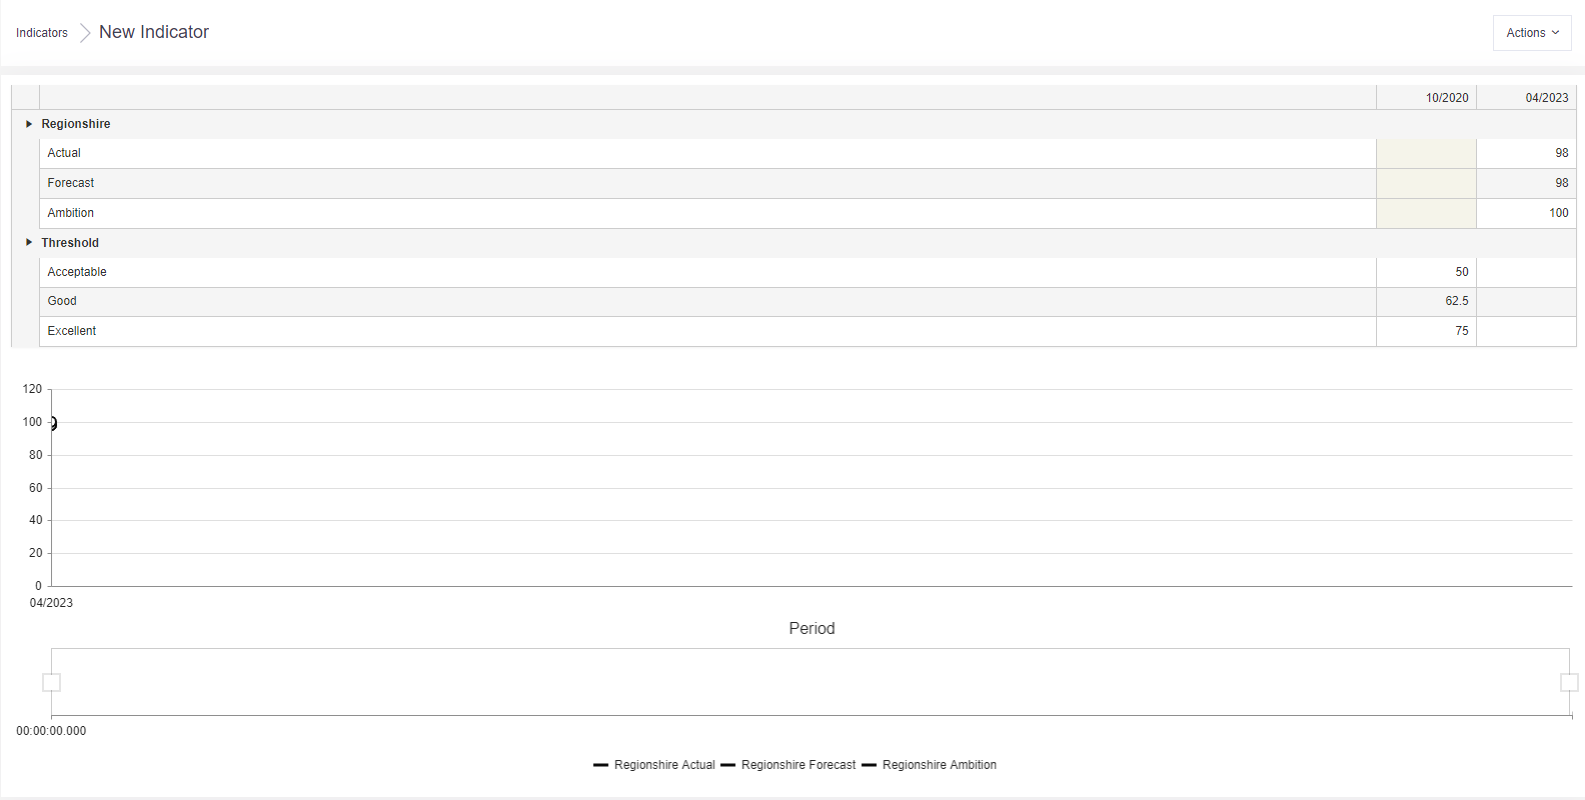
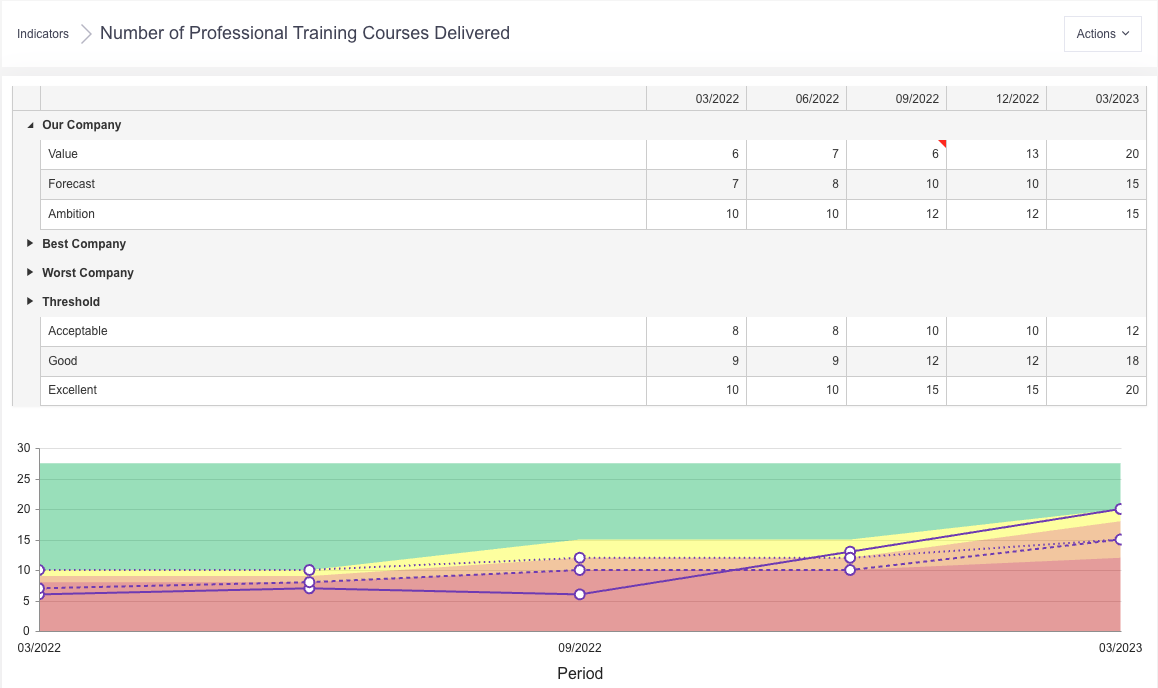
Setting thresholds for an indicator
To set thresholds for each data point, enter figures into the table for Acceptable, Good and Excellent. These will be shown as distinct colour bandings on the graph so that it is easy to see how the actual data points compare against the thresholds.
Remember
- Only a Stage Administrator can add a new indicator.
- Indicator Members can be added to an indicator with either Read Only or Read/Write role permissions. A user with Read/Write permissions will have access to the Indicators tab and be able to update their indicators via this route.
- Indicator Member role permissions are managed in the same way project role permissions are, against the the Performance Indicator stage configuration.